
Bio
I am Xinyu Zhang*, linguist in training. I currently work as a PhD candidate at CLS Radboud and International Max Planck Research School for language sciences.
My research interest lies primarily in phonetics. For my PhD project, I study the relationship between speech production and speech perception, by looking at both typical and clinical populations.
Previously I studied at ACLC of University of Amsterdam, under the supervision of Dr. Rob van Son and Dr. Paul Boersma. My main areas of interest are phonetics and phonology, acoustic and articulatory phonetics, and production-perception interaction.
My most recent research projects include a study on the cross-generation auditory dispersion of the Dutch sibilants /s/ and /ɕ/, and a study of the psychoacoustics of perceived voice qualities after the treatment of laryngeal carcinoma.
Please like and subscribe :)
* Prescribed pronunciation: [ɕin˥˥ɥy˨˩˦ ʈ͡ʂɑŋ˥˥], but I welcome and am interested in all phonological adaptations.
News
I will be presenting my production experiment at the Dag van de Fonetiek on 31 Oct.
I will be presenting at Max Planck Institute's Bite-Sized Insights on 7 Oct. Come see me during your lunch break :)
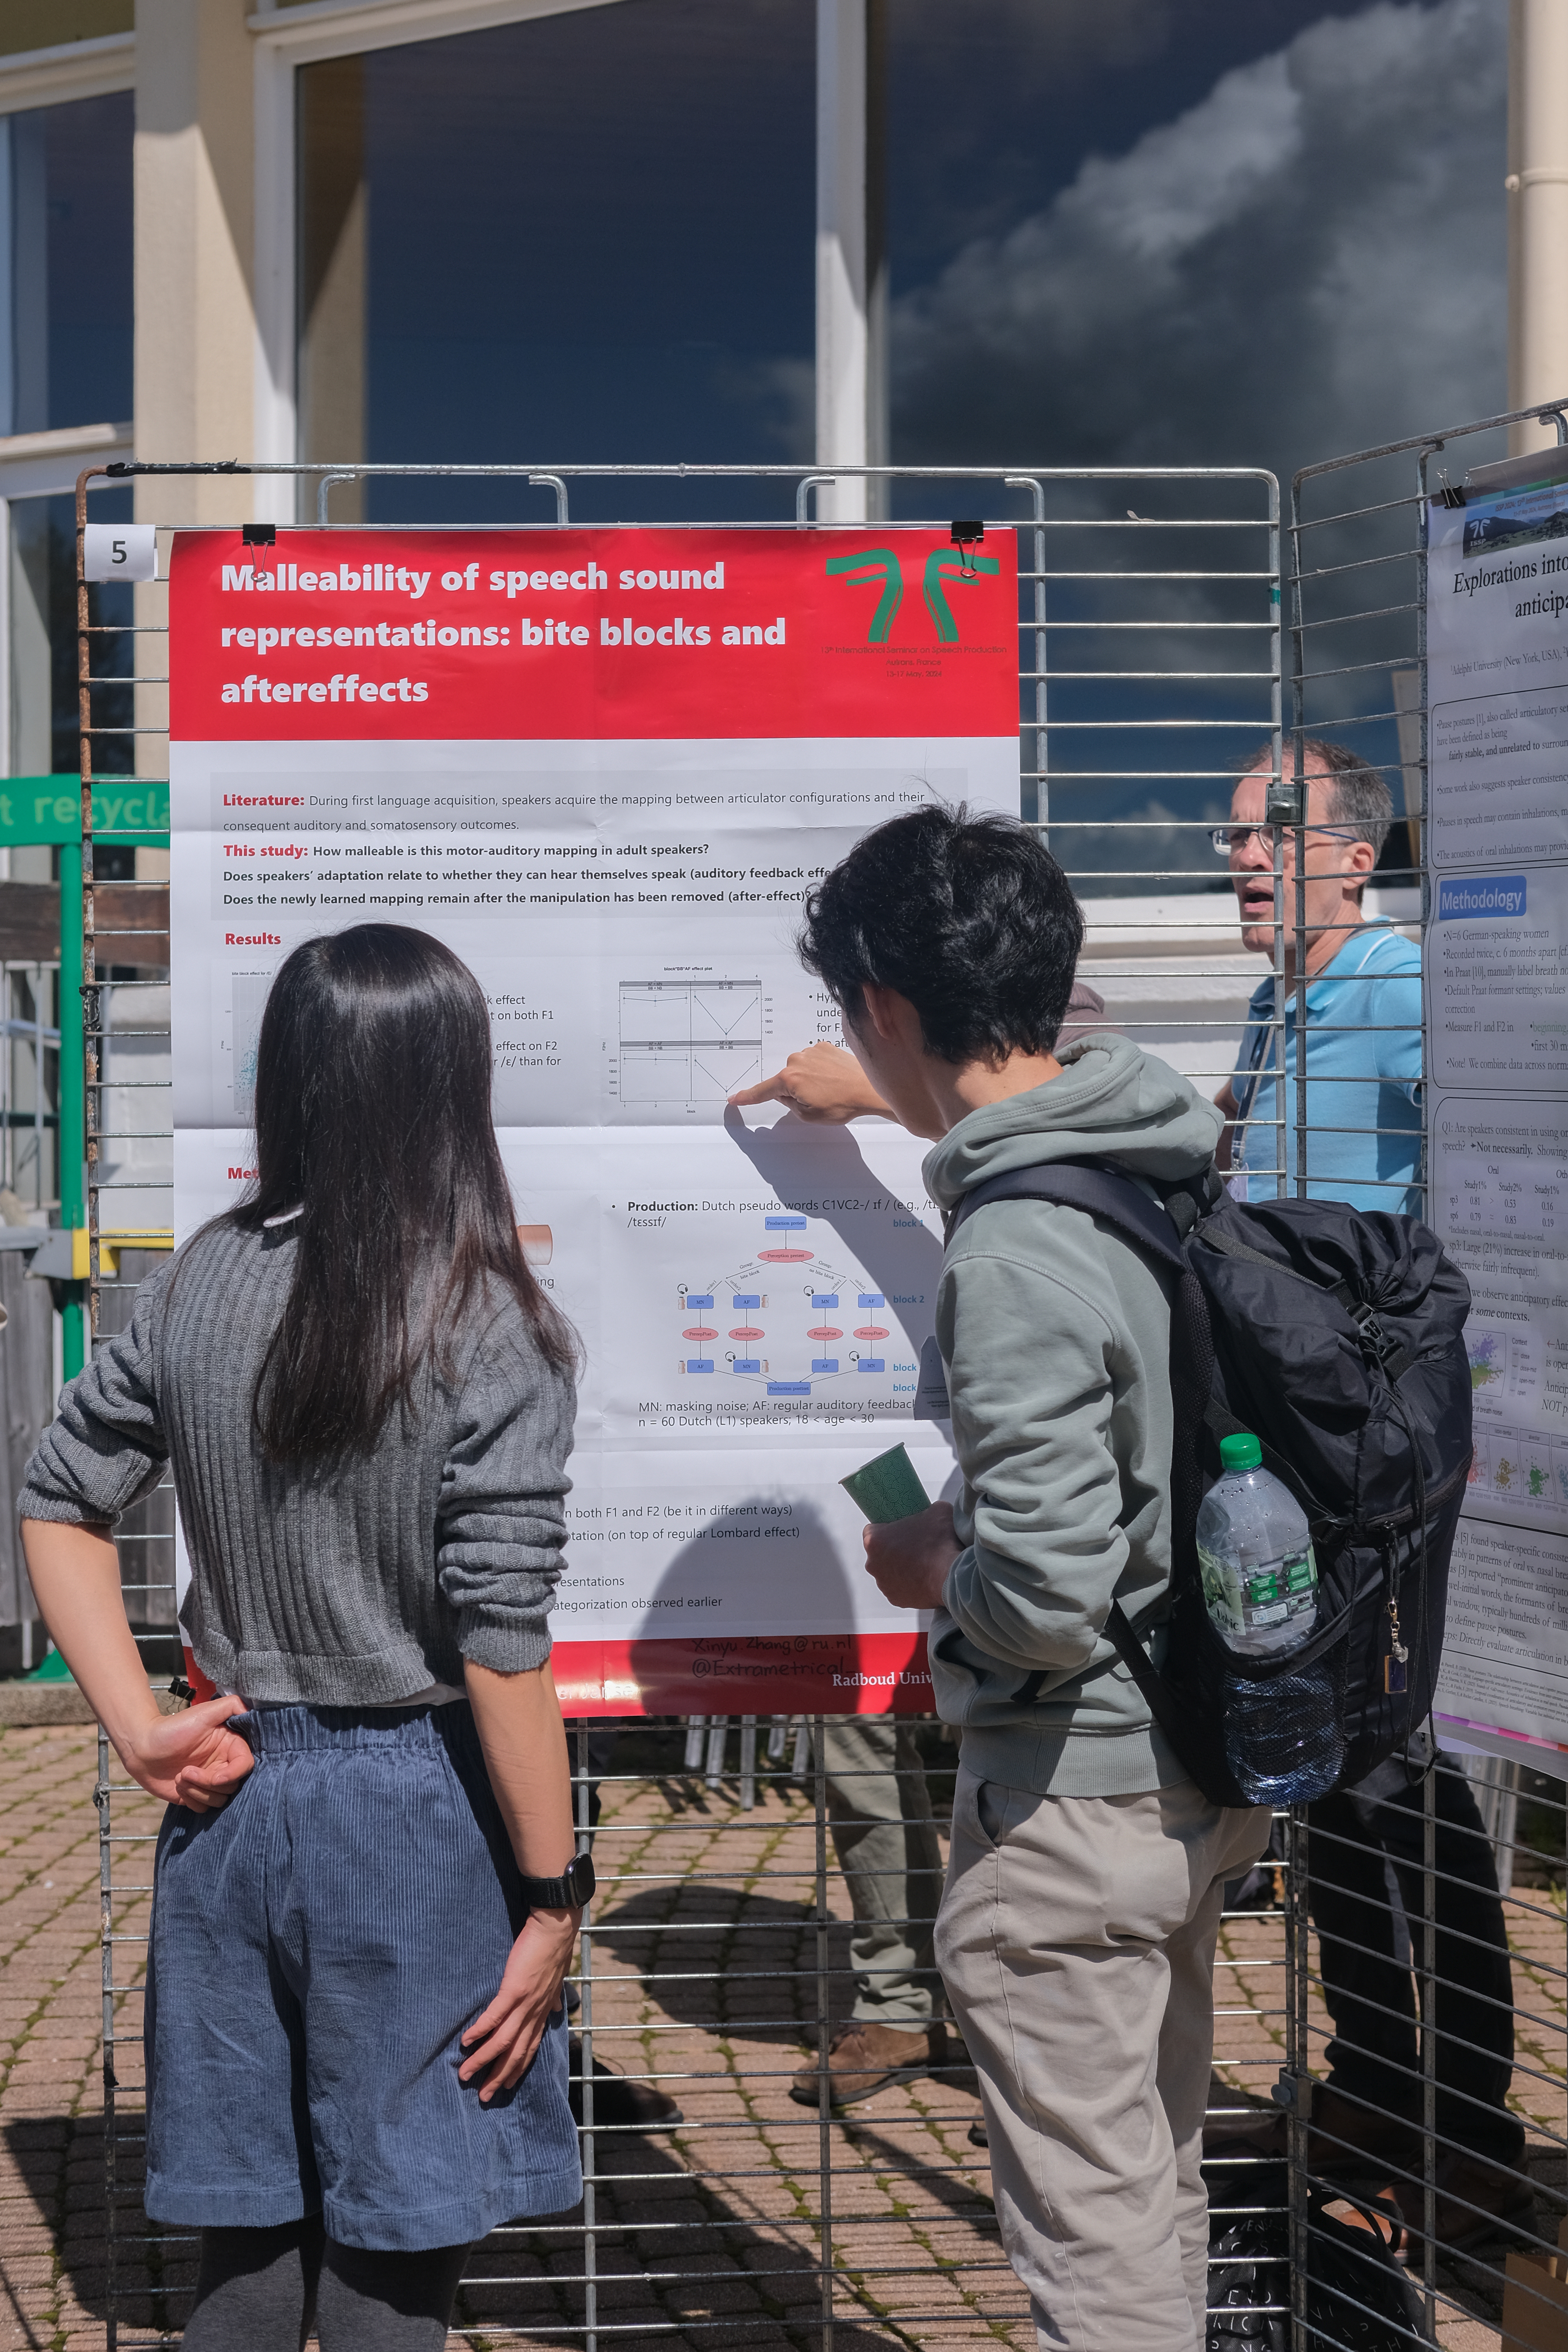
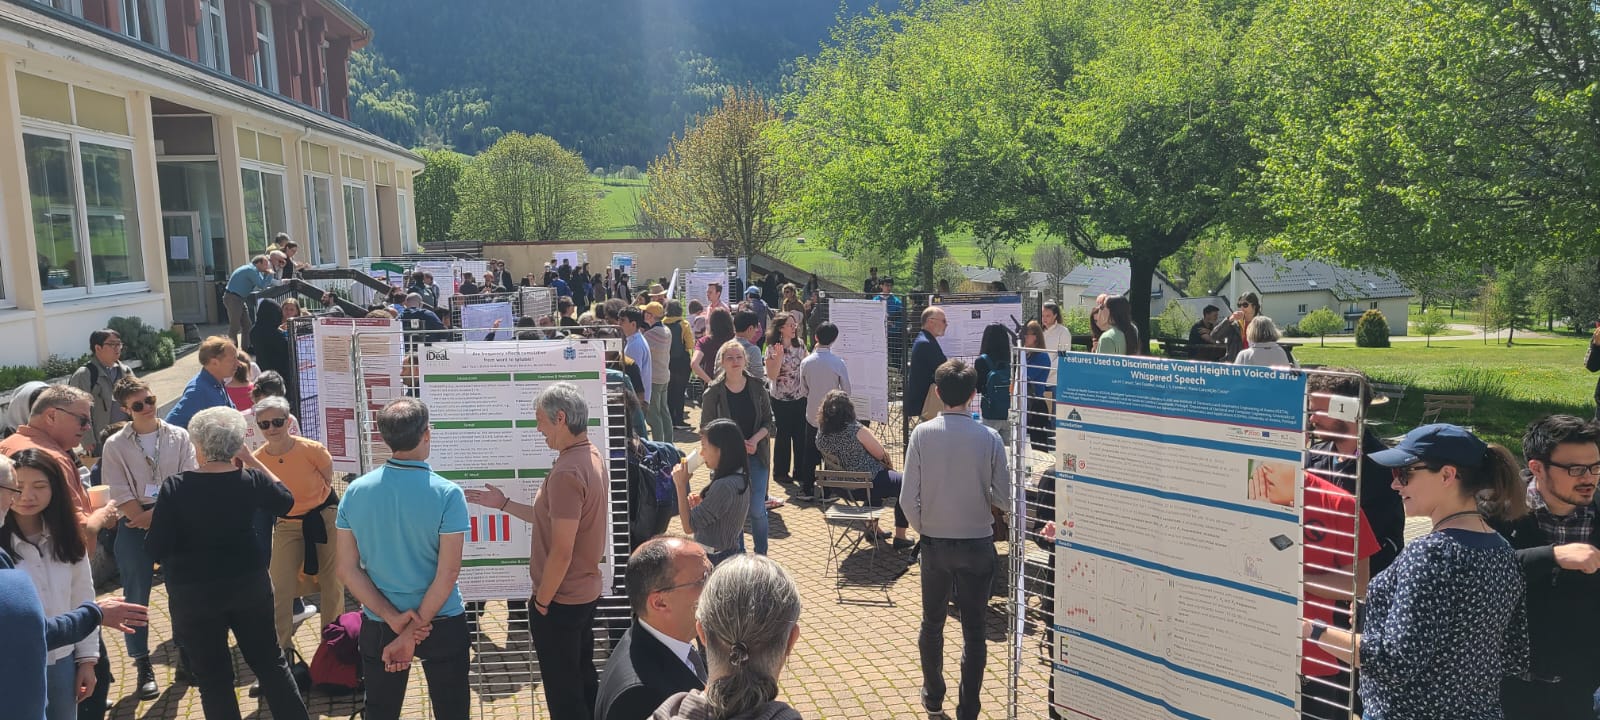
I was at ISSP in Autrans, France, and had a blast!
I will be presenting at ICPhS in Prague! Dream conference since many ICPhSes ago <3
Education
Radboud University /
IMPRS Graduate School Max Planck Institute for Psycholinguistics | Nijmegen, The Netherlands
PhD in Linguistics | September 2021 - now
University of Amsterdam - ACLC | Amsterdam, The Netherlands
rMA in Linguistics | September 2019 - 2021
University of Amsterdam | Amsterdam, The Netherlands
MA in General Linguisitics | September 2018 - August 2020
Party Tricks
Praat sings Happy Birthday | Praat Script | © Xinyu Zhang, 2019
Let R automate participant notification email for ya | R script + Rmd|© Mine Çetinkaya-Rundel, 2015; modified by Xinyu Zhang, 2021
Results from the voice quality study:
Progress as of March 3, 2021
View slides
Some highlights:
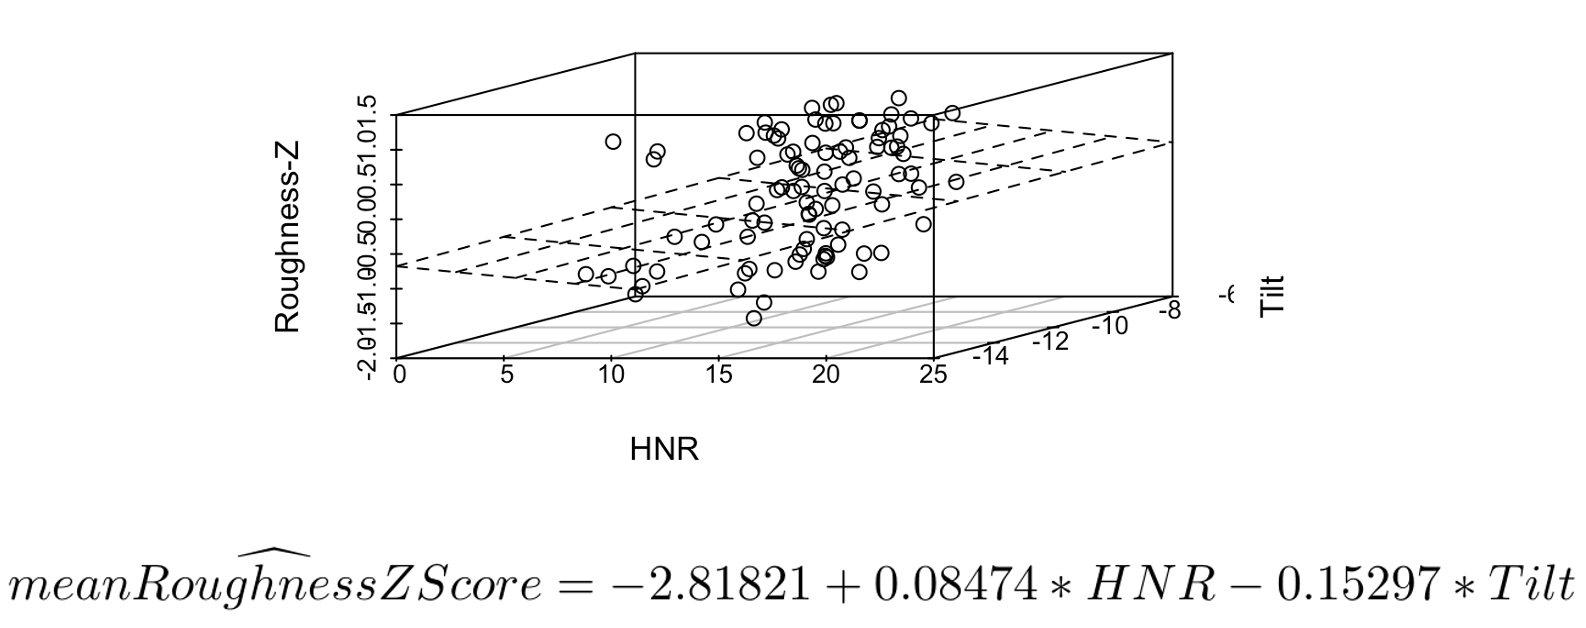
Roughness as predicted by acoustic measurements
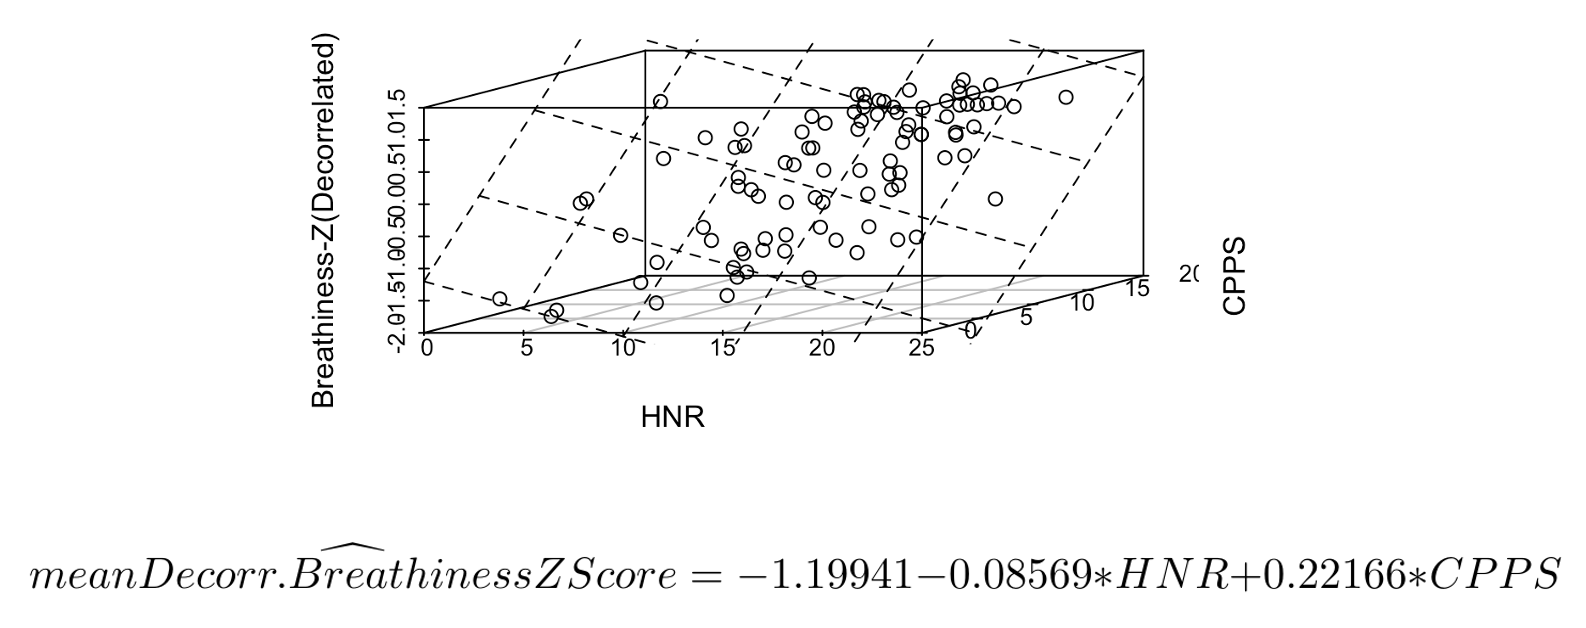
De-correlated breathiness as predicted by acoustic measurements
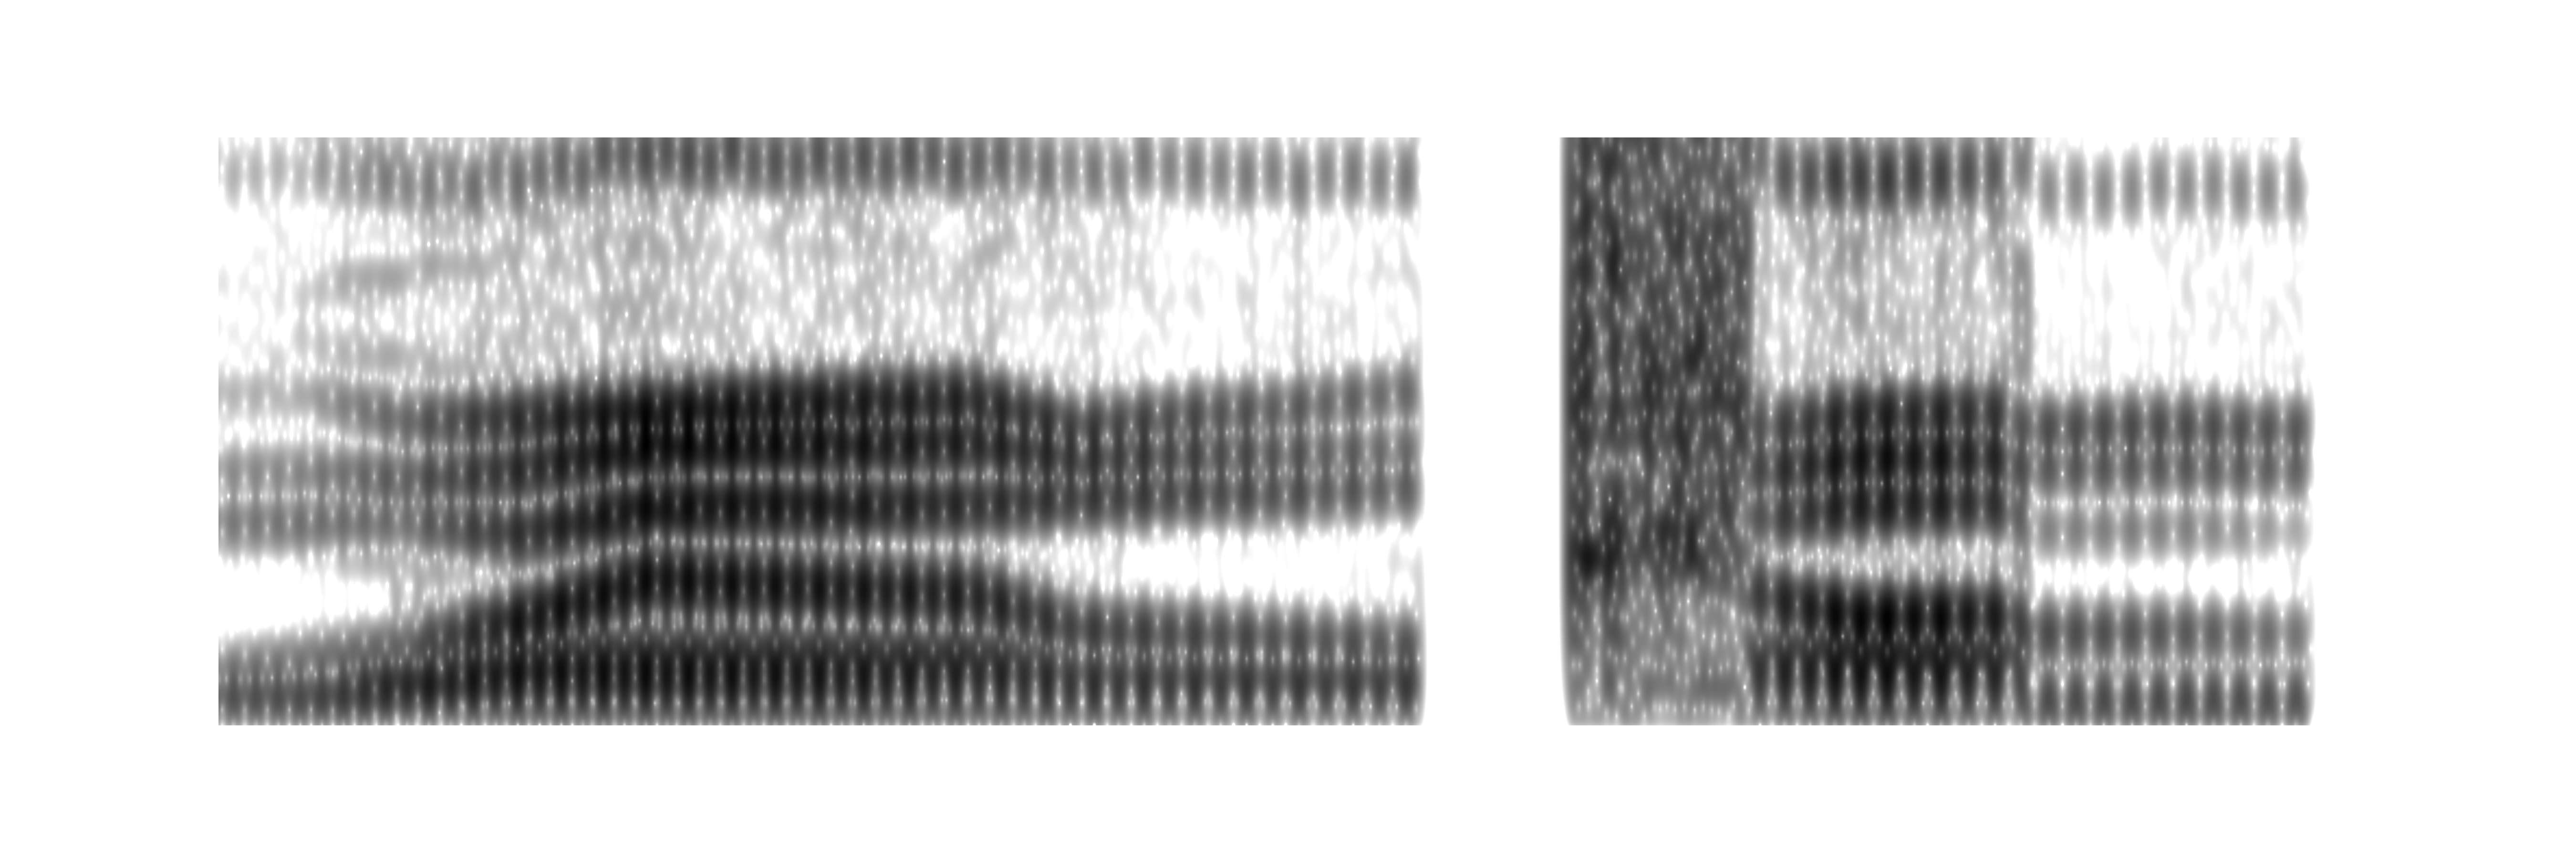
Results from the sibilant study
(All participants who indicated interest in the findings on the consent form have been emailed the full results. Thank you all for donating your voices <3)
If you want to read the whole paper: PDF.
Otherwise, some TL;DR:
Acoustic distance between [ɕ] and [s] in each participant, separated by age group:
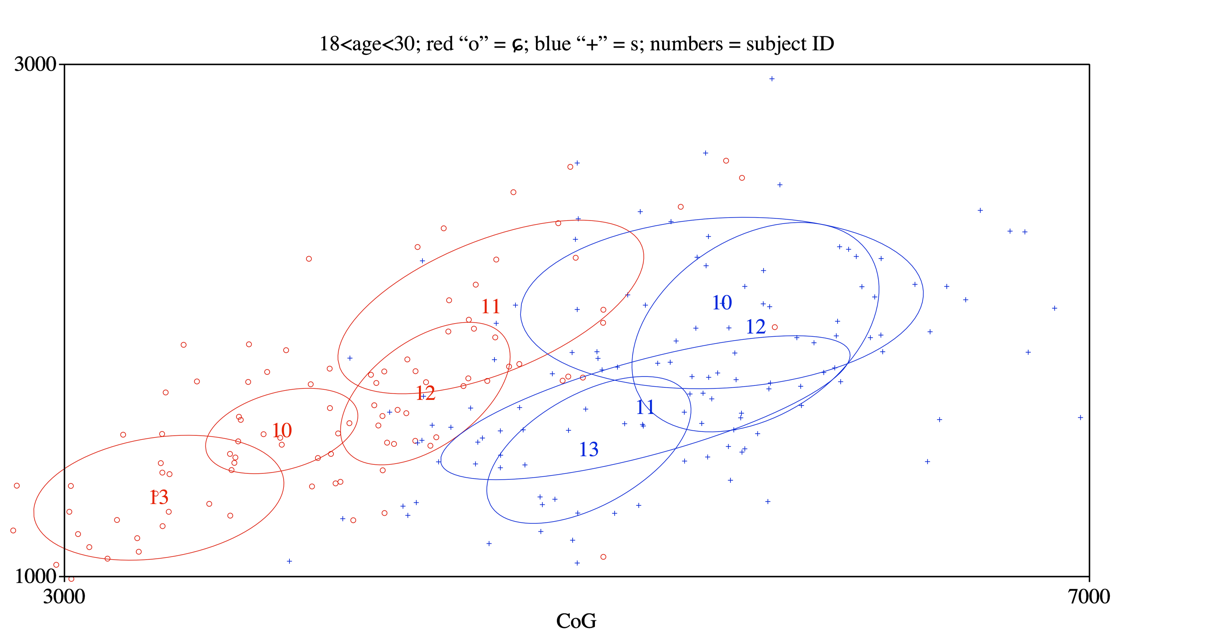
Speakers aged between 18-30, Center of Gravity on X-axis, standard deviation of the peak on Y-axis
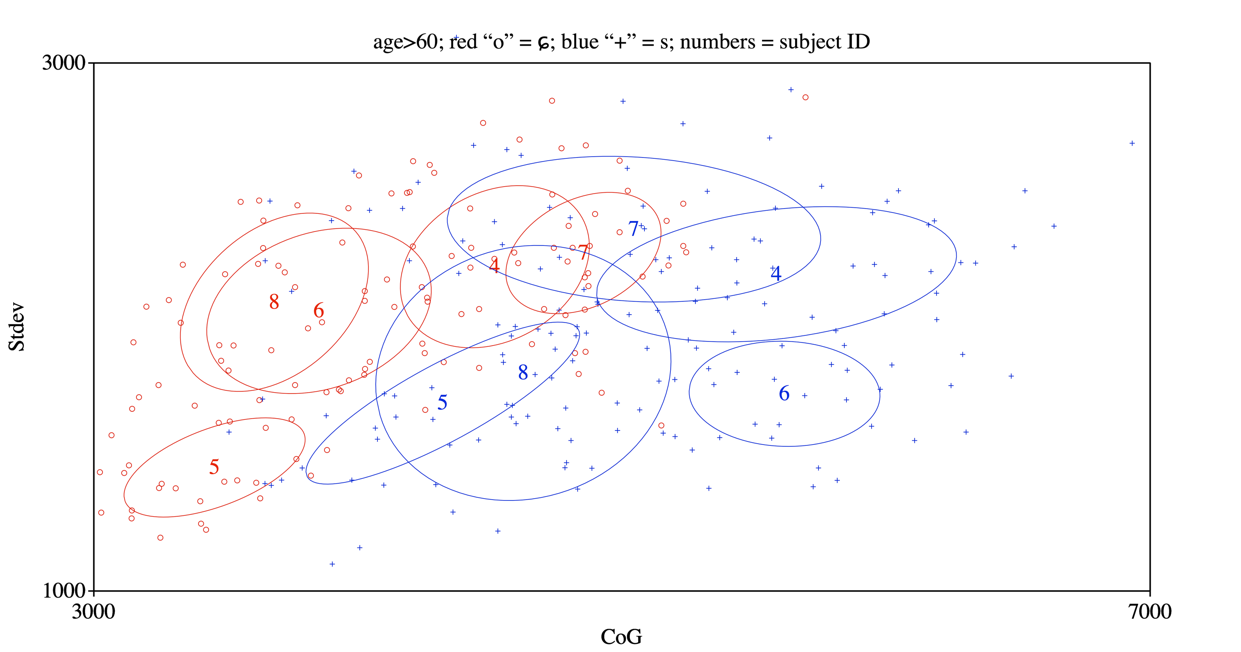
Speakers aged above 60, Center of Gravity on X-axis, standard deviation of the peak on Y-axis
The red and blue circles in the above plot for older speakers have more overlap than in the first plot for young speakers.
Alternatively, if we run a PCA on energies by frequency bins:
“Elements” in the following plots refer to frequency bins in the long-term-average-spectra (bin width = 250 Hz, LTAS range = 550 - 10000 Hz).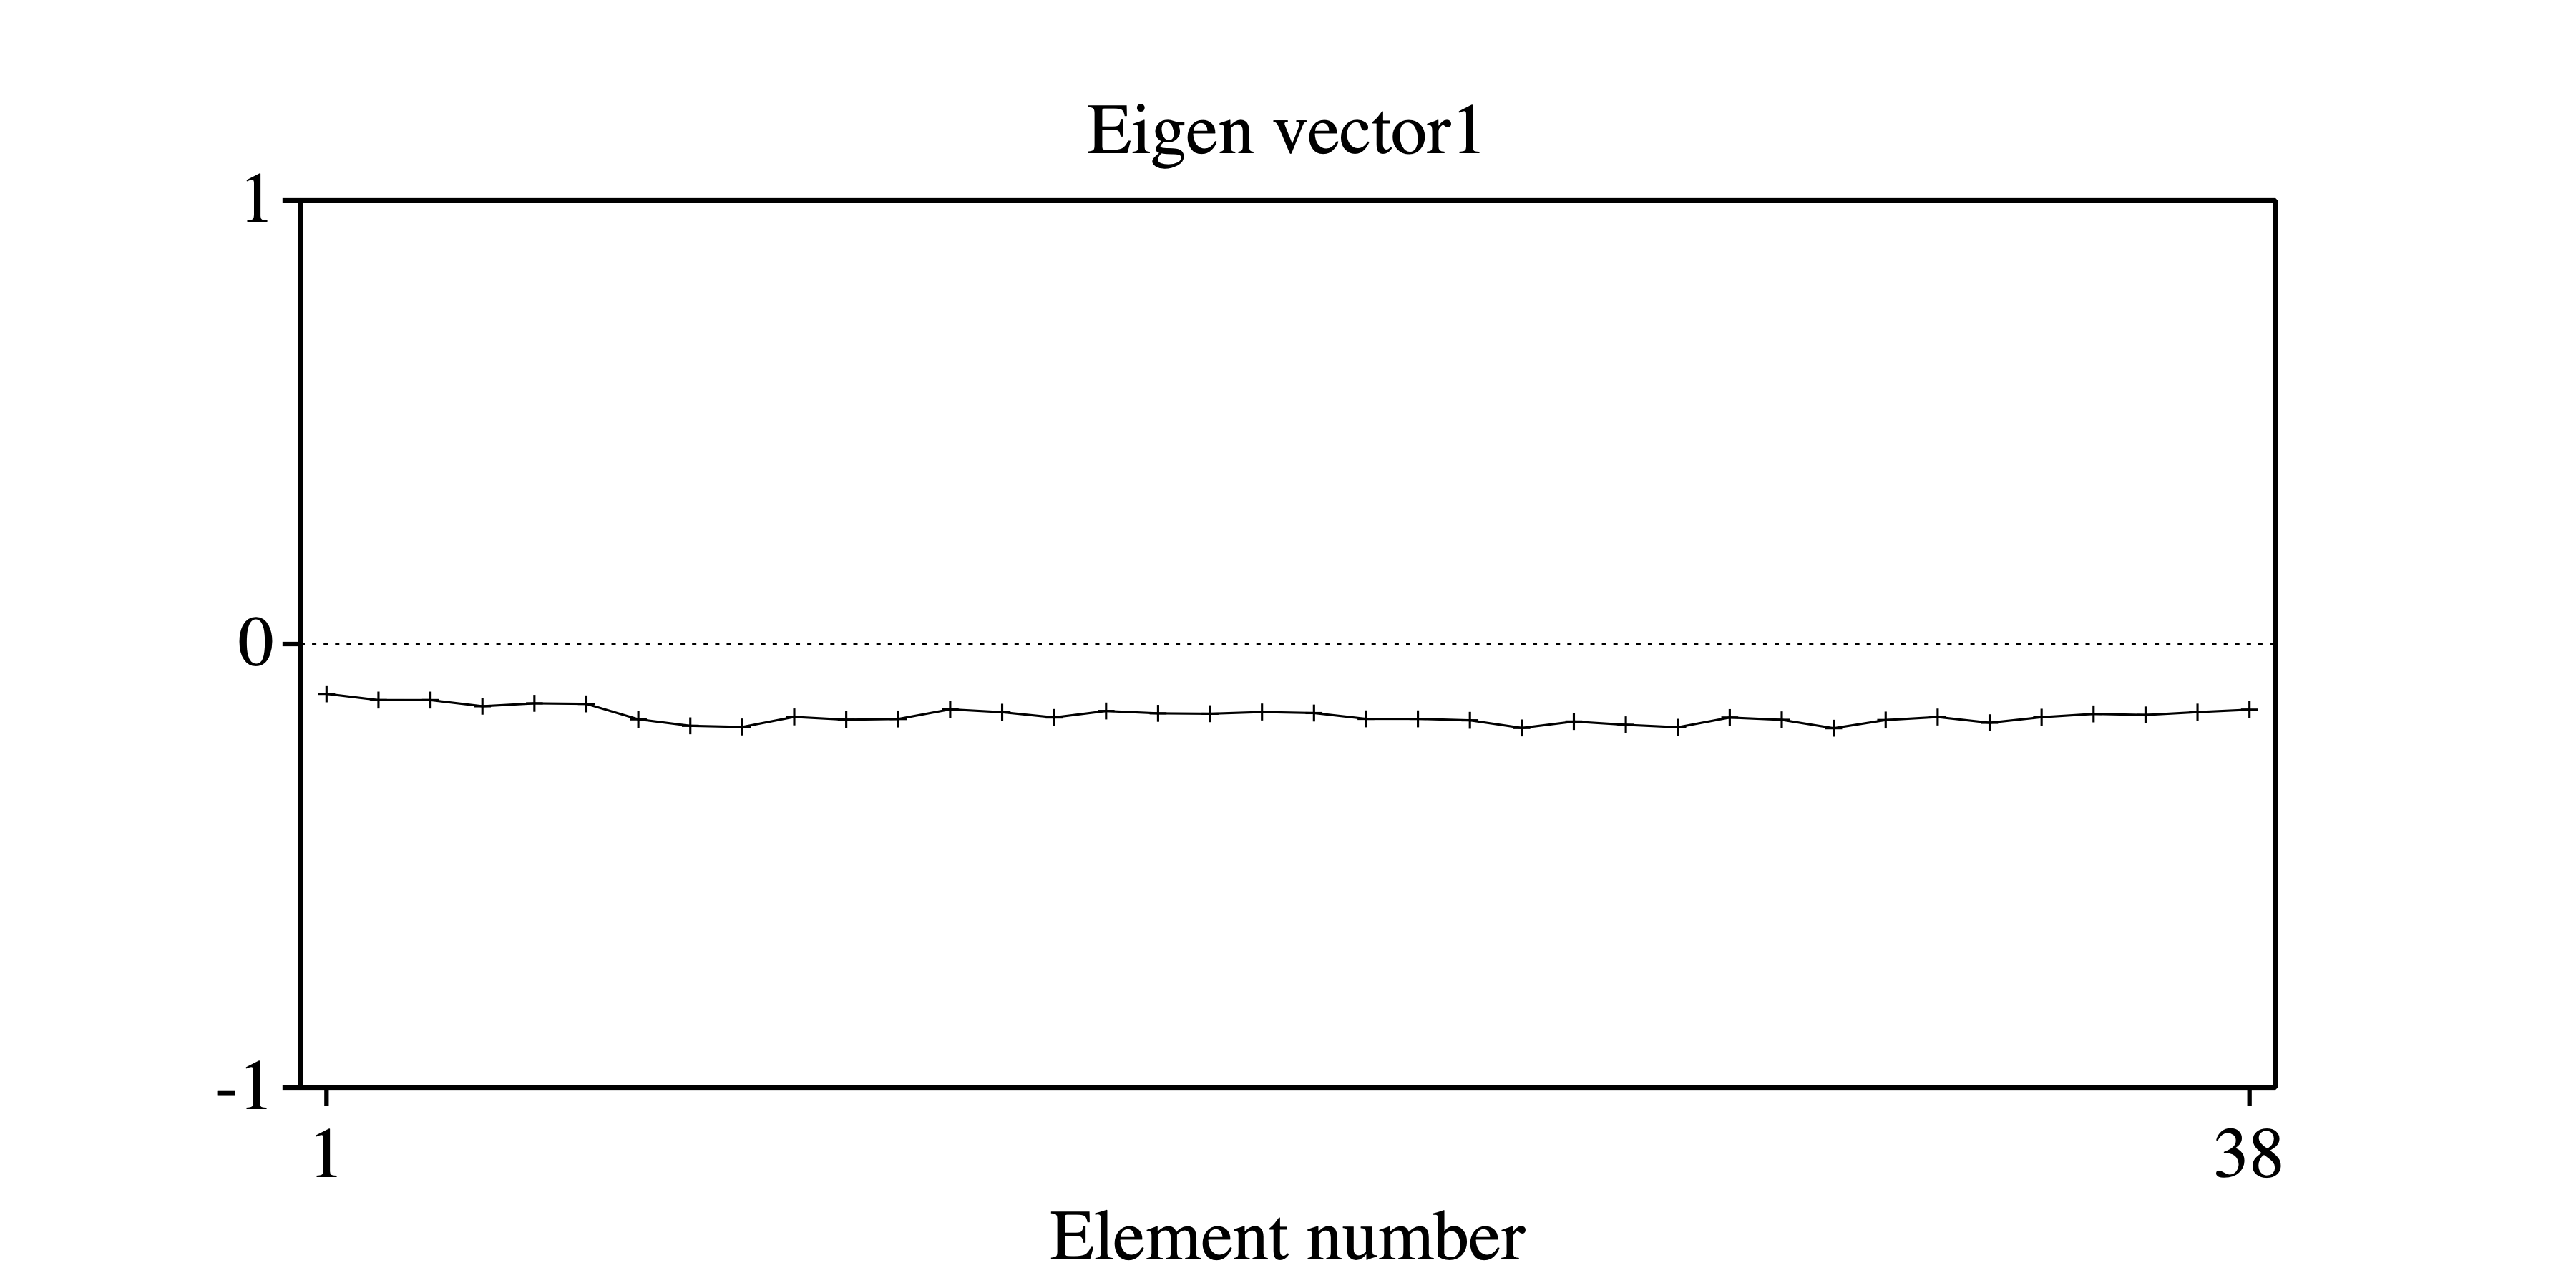
Eigenvector 1 looks like it’s just amplitude difference
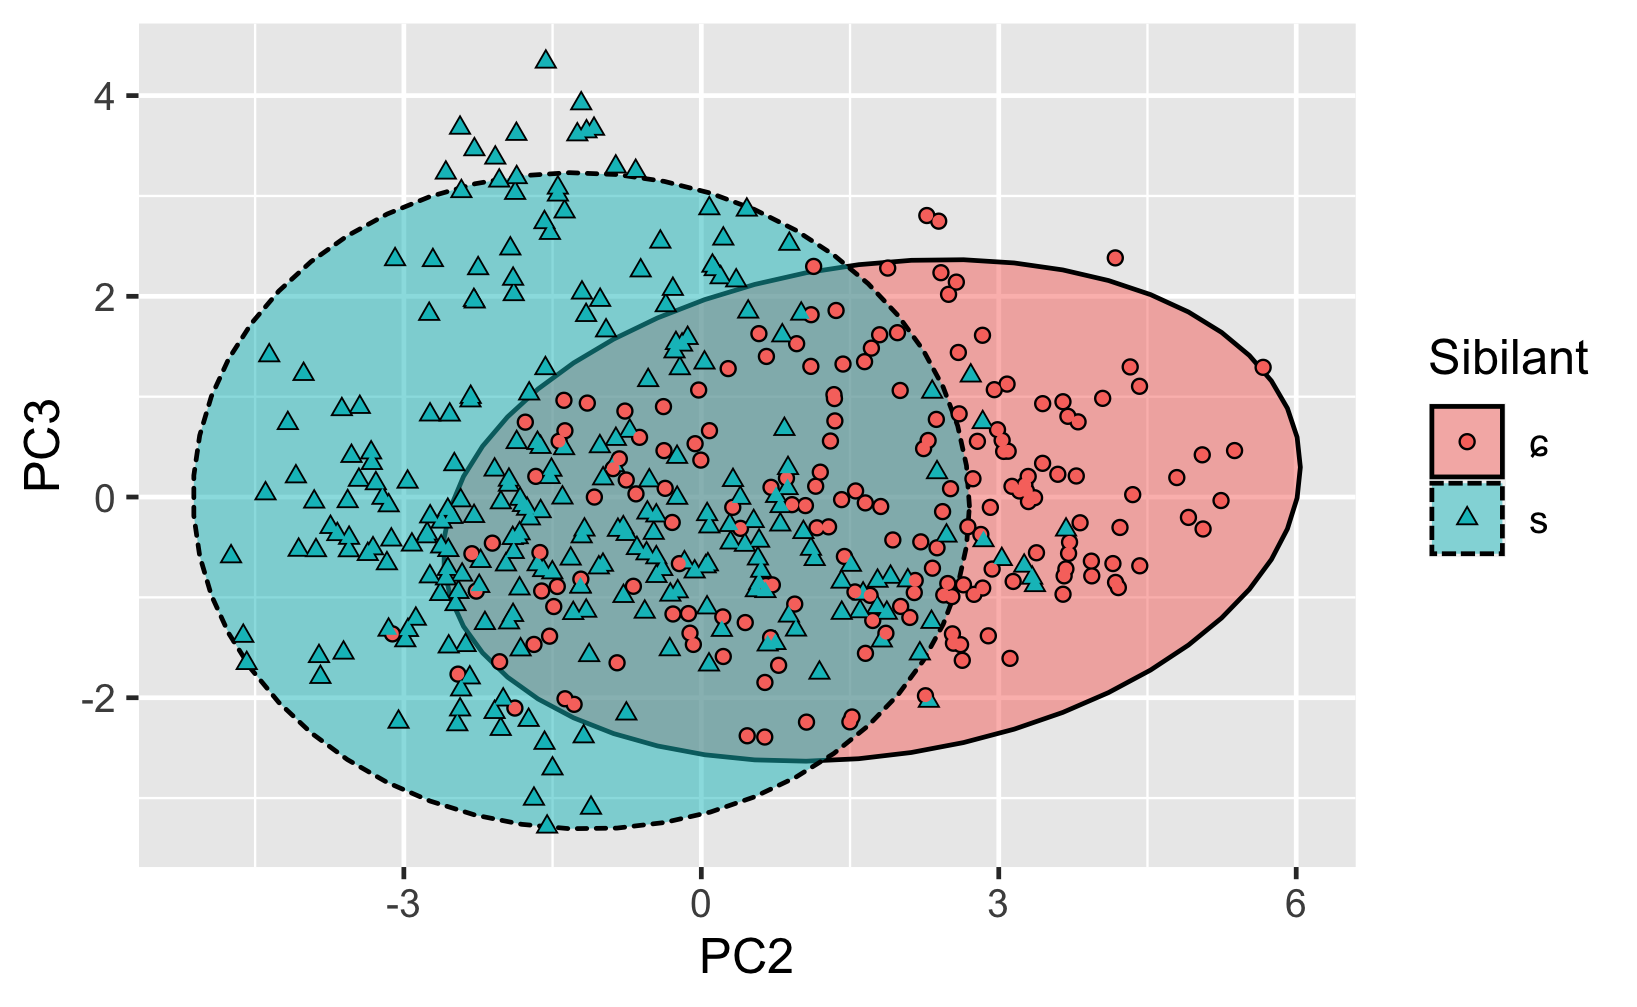
age > 60
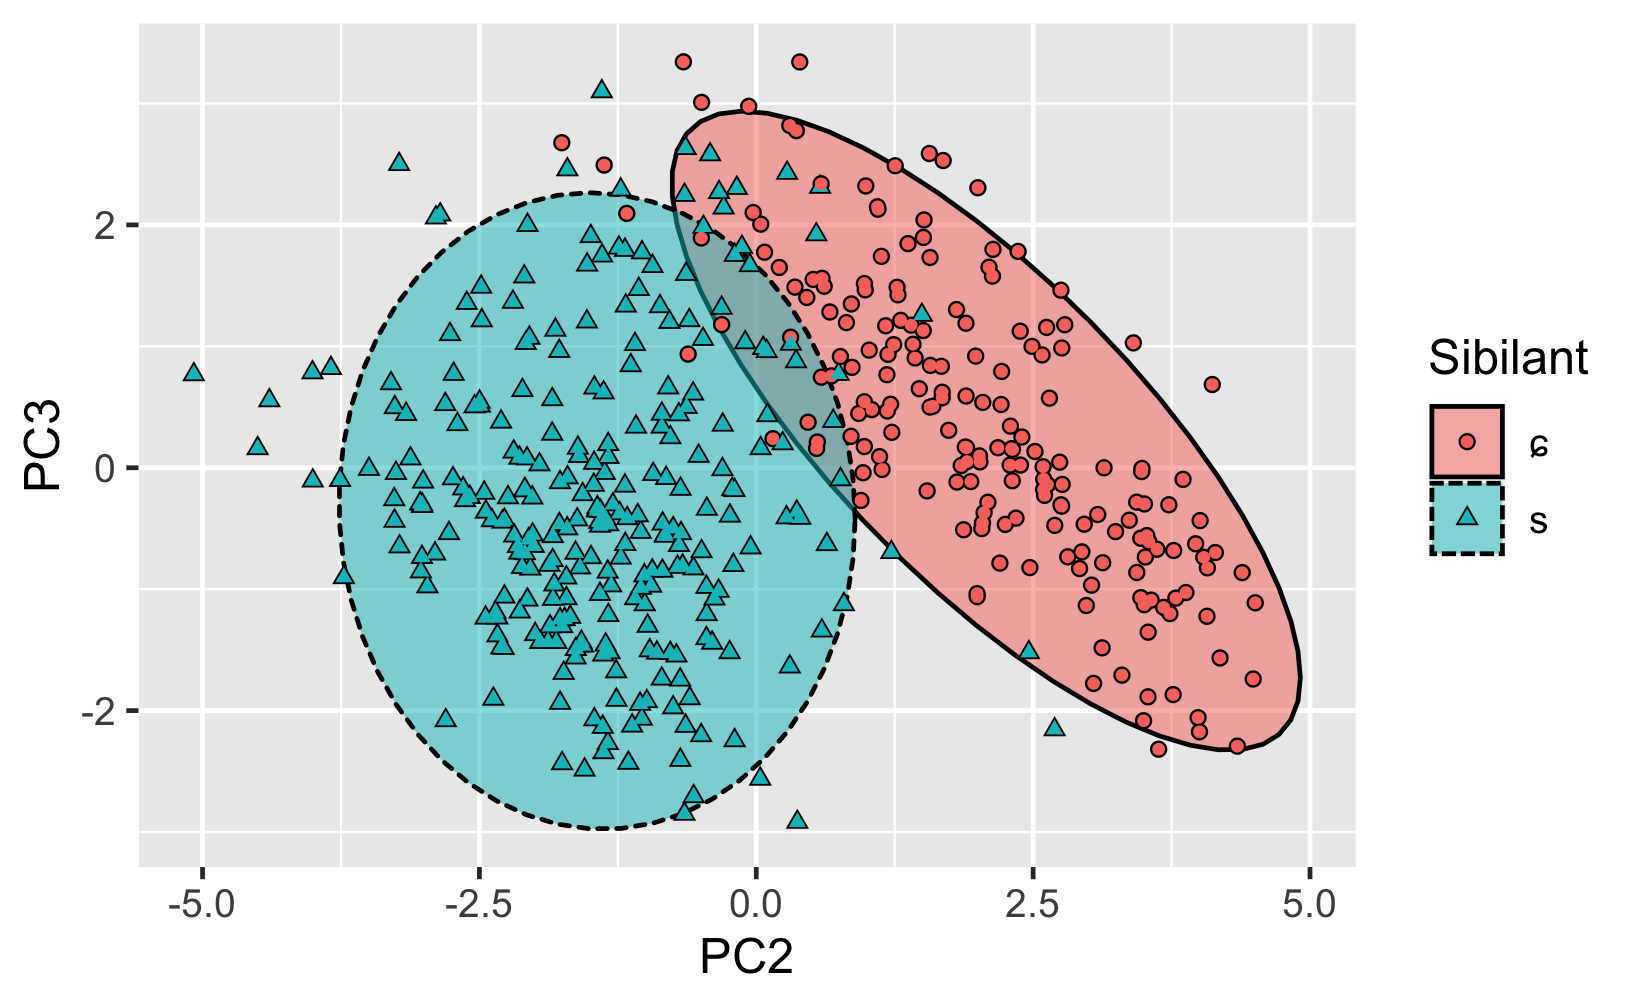
18< age < 30
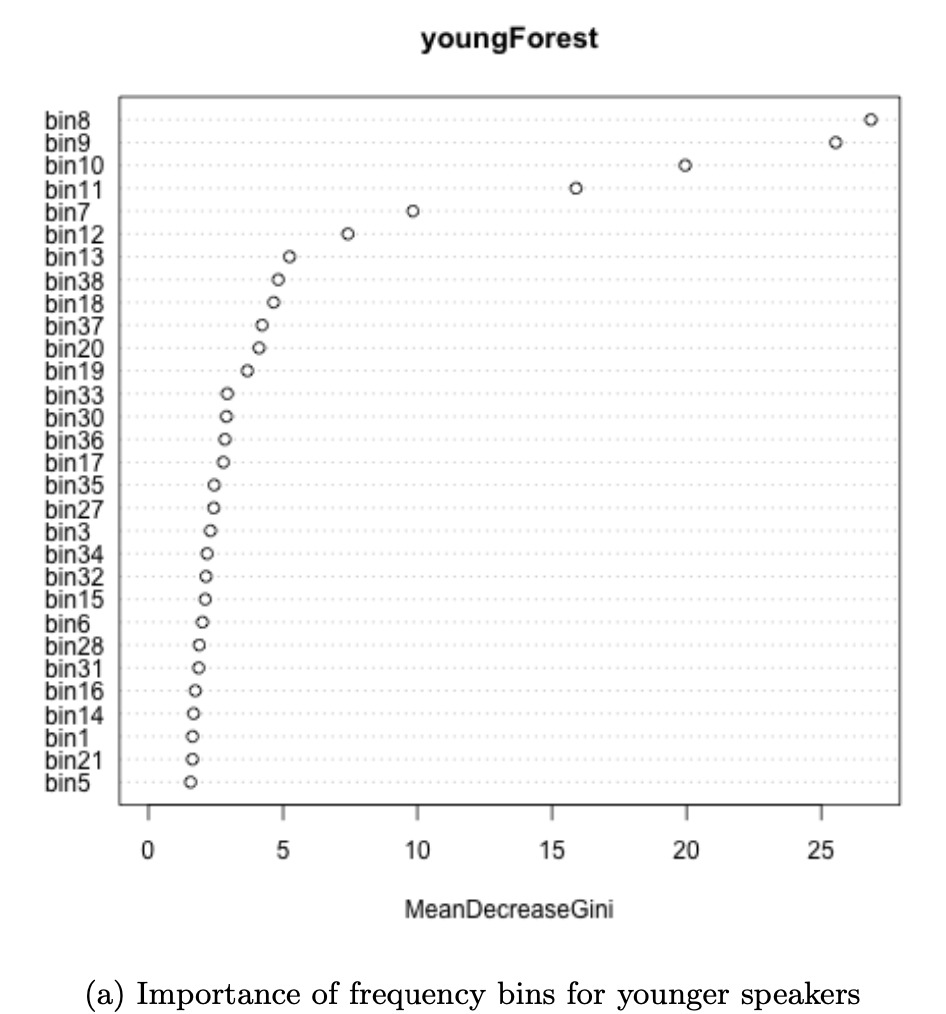
ranking of bins in the younger speakers
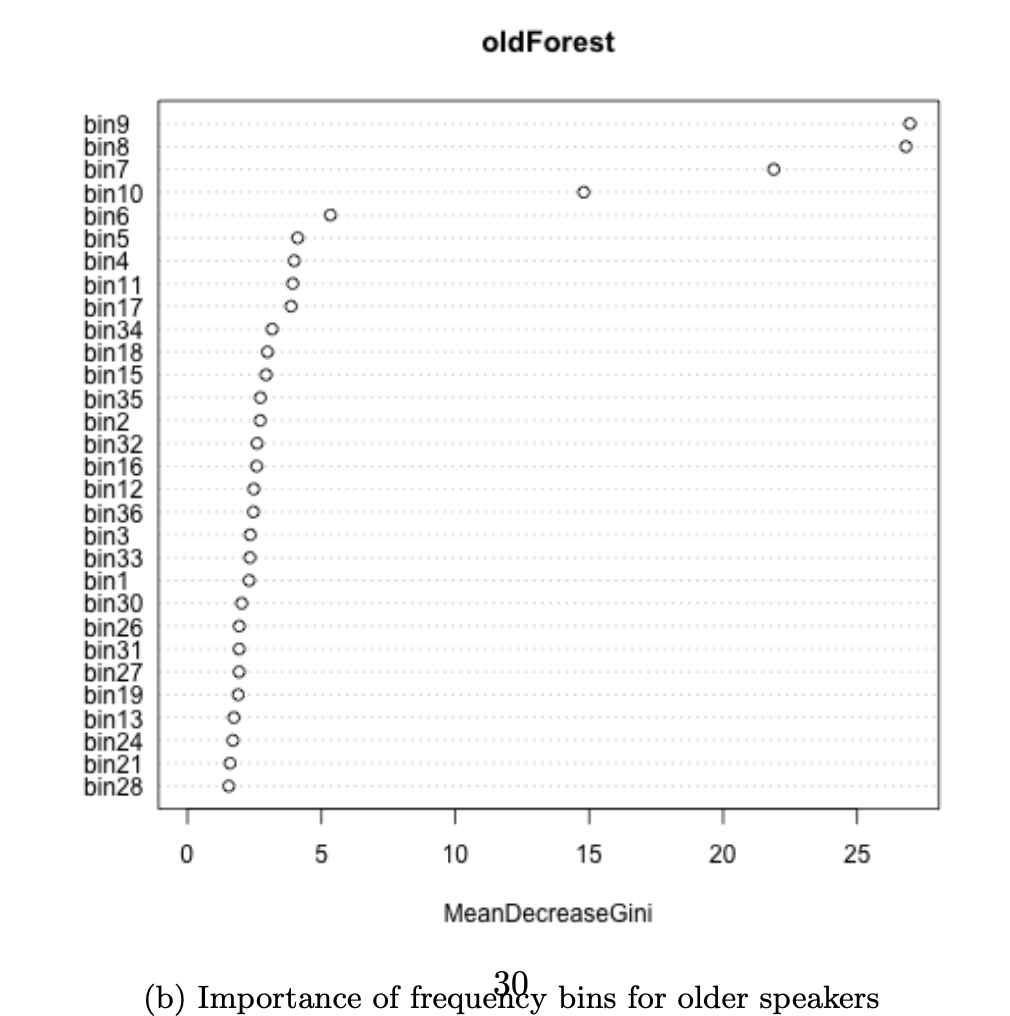
ranking of bins in the older speakers
Things you didn’t need to know:
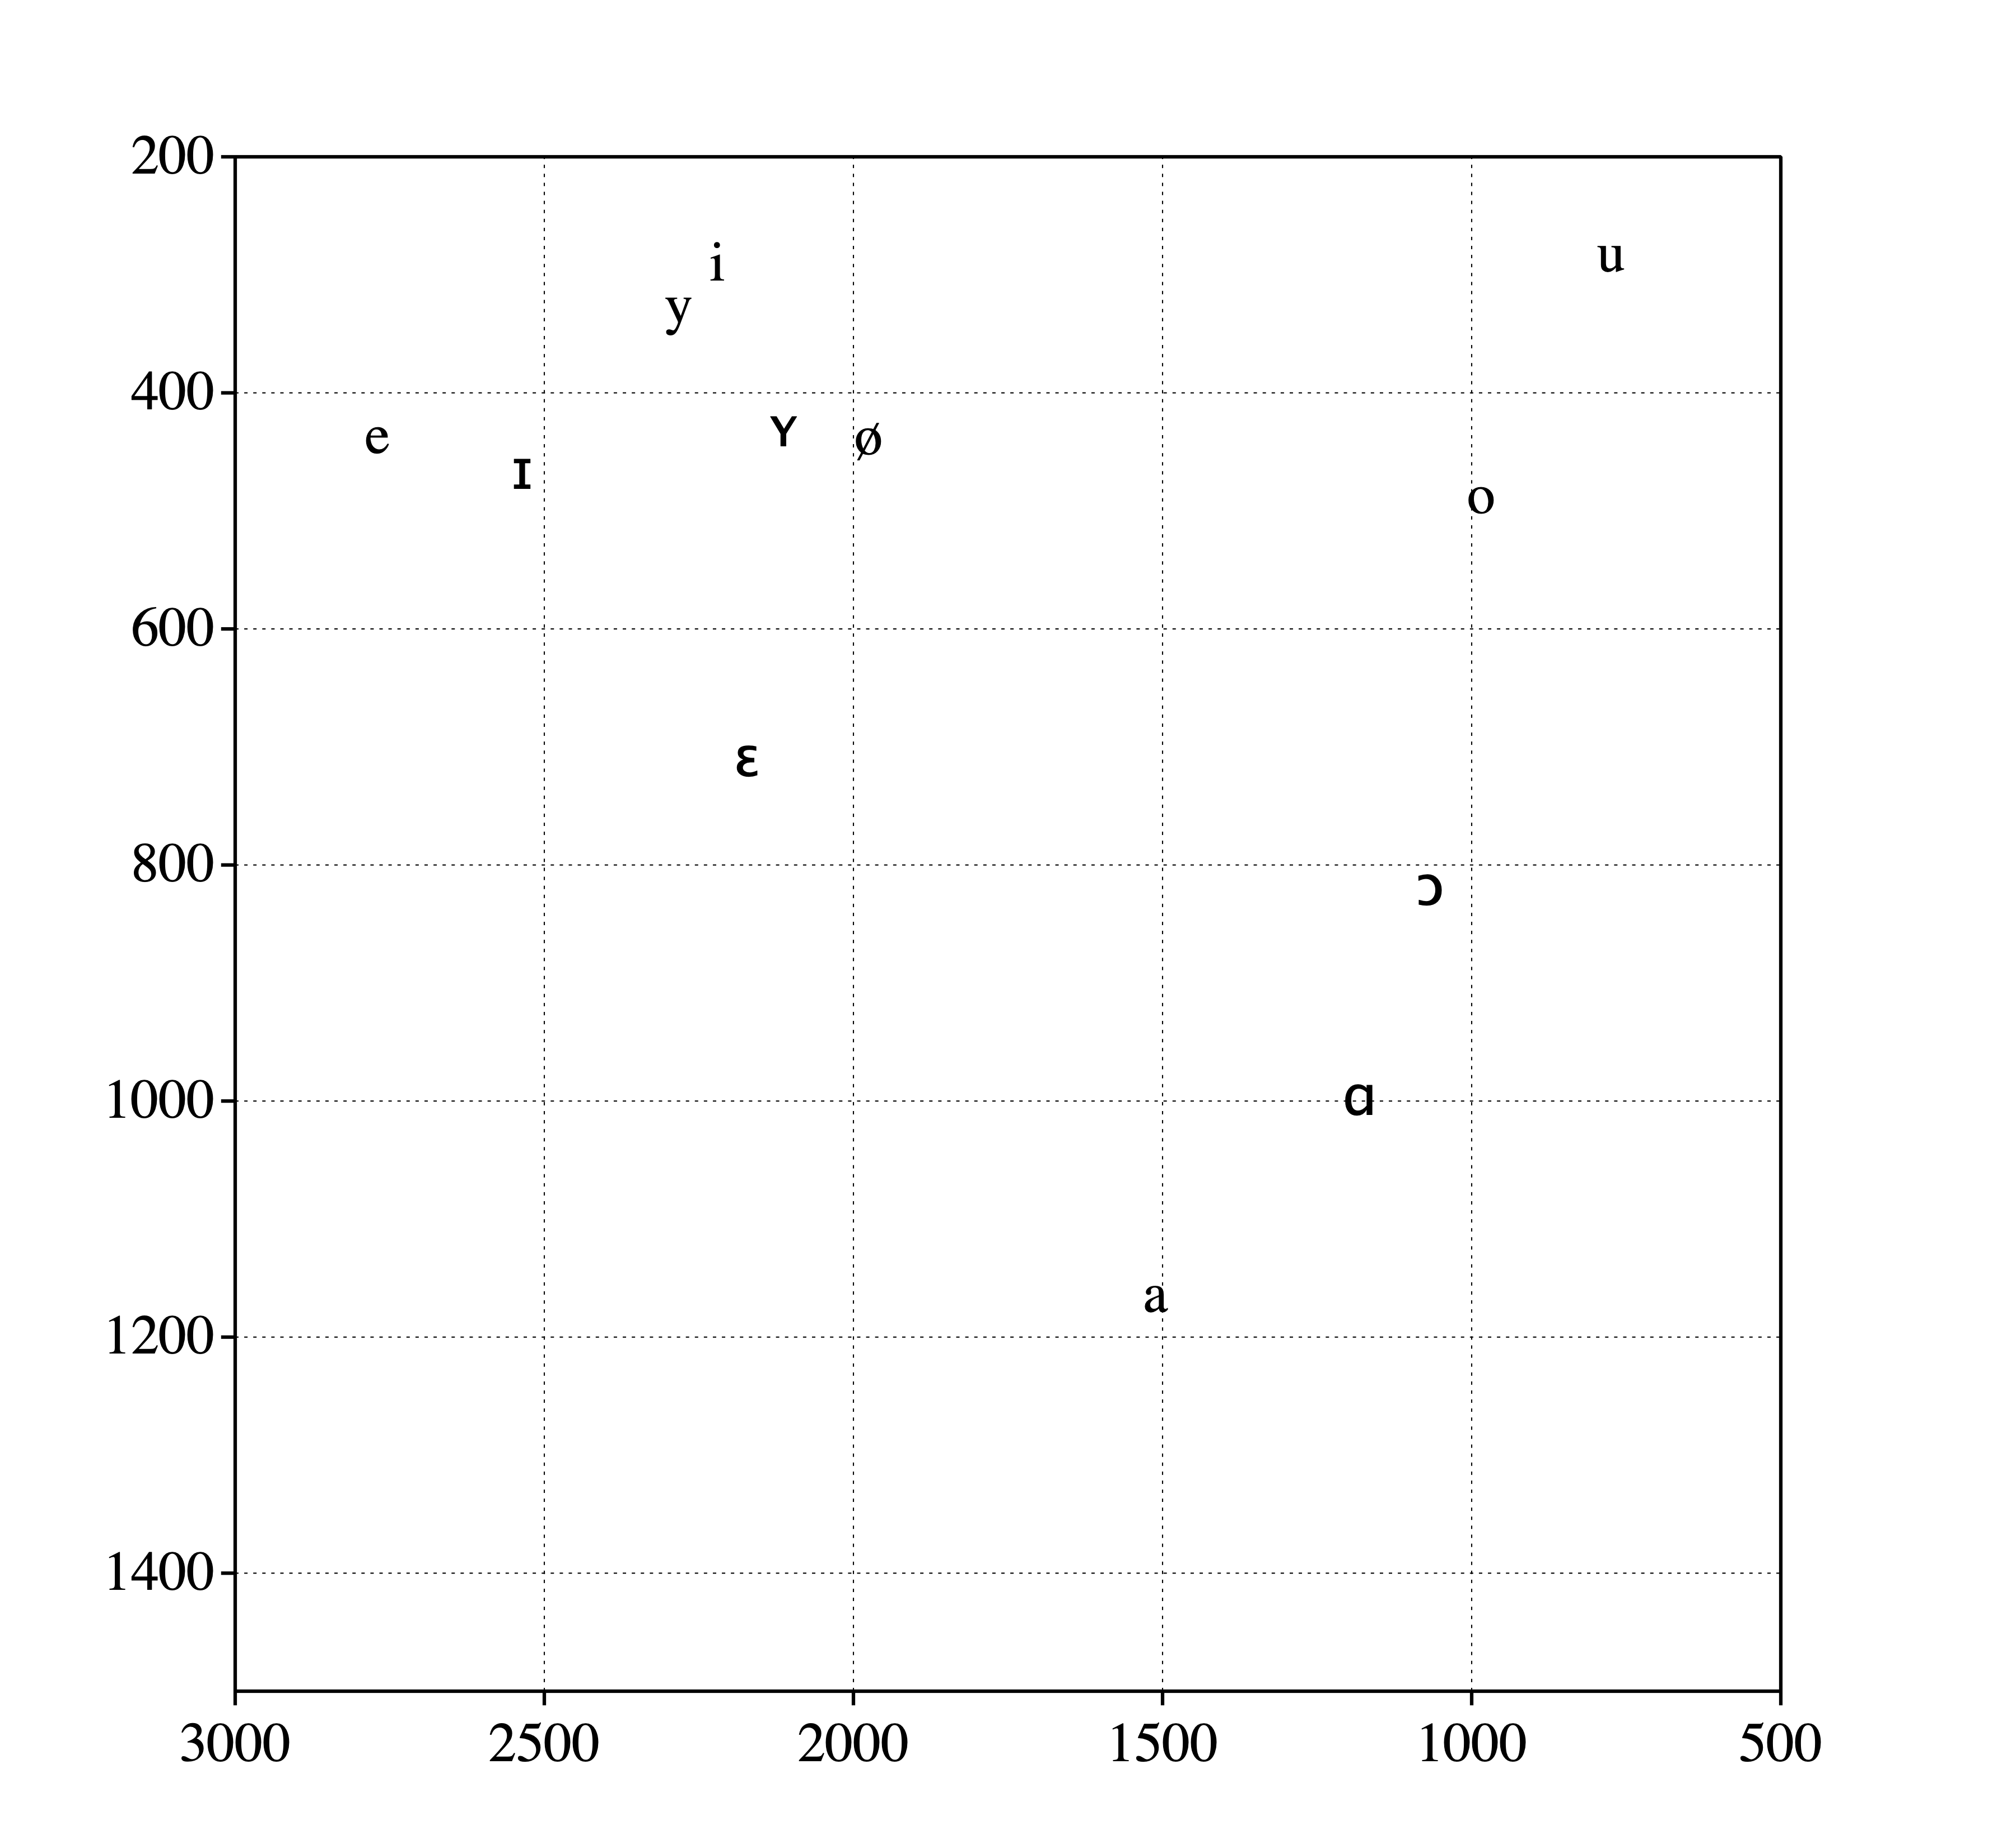
If you want to get to know me a tiny bit better, here are my cardinal vowels plotted.
(I mean, what better way to get to know someone, right?)
Also, I play the sacriligious otamatone